
Page 49 - COS-FOD2015
P. 49
Compend. Oral Sci:vol1(6);2015;40-46
1
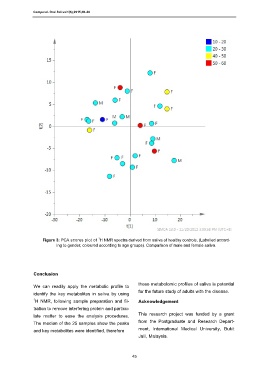
Figure 3: PCA scores plot of H NMR spectra derived from saliva of healthy controls. (Labelled accord-
ing to gender, coloured according to age groups). Comparison of male and female saliva.
Conclusion
these metabolomic profiles of saliva is potential
We can readily apply the metabolic profile to
for the future study of adults with the disease.
identify the key metabolites in saliva by using
1
H NMR, following sample preparation and fil- Acknowledgement
tration to remove interfering protein and particu-
late matter to ease the analysis procedures. This research project was funded by a grant
from the Postgraduate and Research Depart-
The median of the 25 samples show the peaks
and key metabolites were identified, therefore ment, International Medical University, Bukit
Jalil, Malaysia.
45